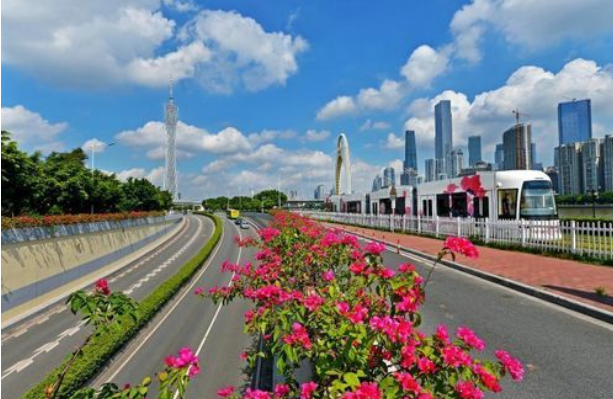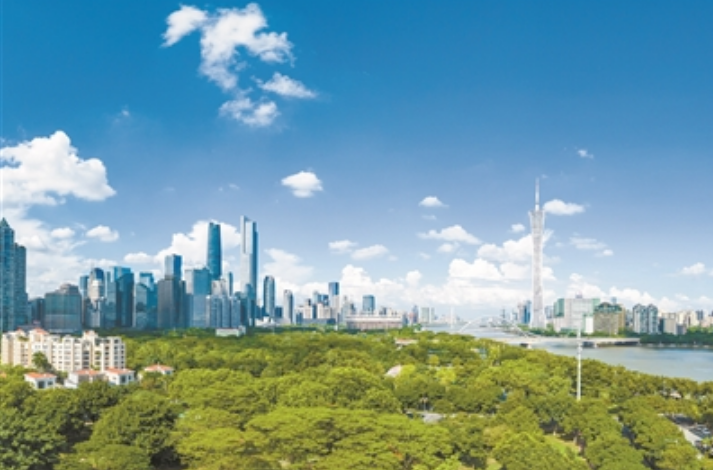
Recently, the Guangzhou Municipal Ecology and Environment Bureau released the city’s air quality data for January to February. Guangzhou’s comprehensive air quality index was 3.62, with 59 days meeting air quality standards, achieving a 100.0% compliance rate. The top three districts in terms of comprehensive air quality index were Conghua, Zengcheng, and Huangpu, while the bottom three were Liwan, Baiyun, and Haizhu.
In terms of the six major pollutant concentrations from January to February, the average PM2.5 level was 32 µg/m³, PM10 averaged 53 µg/m³, nitrogen dioxide averaged 33 µg/m³, sulfur dioxide averaged 6 µg/m³, ozone concentration was 129 µg/m³, and carbon monoxide concentration was 0.9 mg/m³.
Additionally, in February alone, Guangzhou’s comprehensive air quality index was 3.03, with a 100.0% compliance rate. The air quality breakdown was: 18 days rated “excellent,” 10 days “good,” with no days experiencing mild or worse pollution. The average PM2.5 concentration was 26 µg/m³, PM10 averaged 42 µg/m³, nitrogen dioxide averaged 26 µg/m³, sulfur dioxide averaged 6 µg/m³, and ozone concentration was 118 µg/m³. The top three districts in the February air quality rankings were Conghua, Zengcheng, and Huangpu, while the bottom three were Liwan, Baiyun, and Haizhu.